Description
The objective of this task is to assess the likely impacts of the scenarios on the sustainability dimensions economy, environment, and society. This step is needed to understand where policy interventions are needed to realise positive impacts and to avoid negative effects.
The economic, social, and environmental impacts of the city-specific do-nothing scenarios are evaluated based on an assessment framework, which was developed by SPROUT partners. The framework consists of
- the main impact (or consequence) areas: Economy, Society, Environment
- a limited set of indicators to assess the development and state of the system; and
- ranges (in %) that can be used to evaluate the direction and magnitude of change per indicator (e.g. an increase by 5-10%; or a decrease for >30%). The suggested ranges differ for the individual questions and indicators; they were derived either from existing studies or from consensus building within the project consortium.
More information on the framework, how it was derived and used is provided in the referenced article by Xenou et al. under “further information” (Xenou et al. 2022)
Taking into account the large number of indicators identified, the indicators were prioritised. The prioritisation process was completed by SPROUT research partners, based on 5 criteria:
Criterion 1: How difficult is estimating the indicator’s future state?
This criterion strengthens the feasibility of the survey and reassures the accuracy of the outcomes by excluding these indicators for which it is not possible to estimate their future state.
| Criterion 1 | Rating scale | ||||
| Estimating the indicator’s future state is | not possible | slightly difficult | moderately easy | easy | very easy |
| 0 | 1 | 2 | 3 | 4 | |
Criterion 2: Is the indicator related to an issue that in the past has been researched?
The second criterion highlights the areas where a knowledge gap is identified and where the pilot could provide missing insight.
| Criterion 2 | Rating scale | ||||
| The indicator is related to an issue that in the past has been researched | extensively | to a large extent | moderately | slightly | not at all |
| 0 | 1 | 2 | 3 | 4 | |
Criterion 3: Is the indicator directly related to New Mobility Services?
| Criterion 3 | Rating scale | ||
| The indicator is directly related to New Mobility Services | No | Indirectly | Directly |
| 0 | 1 | 2 | |
Criterion 4: Is the indicator already included in the SPROUT Urban Mobility Transition Inventory?
| Criterion 4 | Rating scale | |
| The indicator is included in the Urban Mobility Transition Inventory | No | Yes |
| 0 | 1 | |
Criterion 5: Does the indicator address a potential consequence already identified?
| Criterion 5 | Rating scale | |
| The indicator addresses a potential consequence already identified | No | Yes |
| 0 | 1 | |
The prioritisation resulted in a list of 30 indicators to assess the city-specific scenarios in terms of their expected impacts on the sustainability dimensions:
| ECONOMY | Expected impact on: |
| Econ CA 1: The urban transport service structure/mix. | |
| Share of public transport (%) | |
| Share of car transport (%) | |
| Share of micromobility (%) | |
| Share of active transport (%) | |
| Share of car sharing transport (%) | |
| Share of green deliveries (cargo bikes, electric tricycles, green autonomous/automated means) (% of daily deliveries) | |
| Share of next hour to same day goods delivery services (% of daily deliveries) | |
| Number of shared dockless bikes | |
| Number of shared e-scooters | |
| Econ CA 2: The urban space allocation | |
| Share of urban space for public transport | |
| Share of urban space for private/shared cars | |
| Share of urban space for cycling/scooter lanes | |
| Share of urban space for pedestrian areas | |
| Number of autonomous/automated PT services on dedicated lanes | |
| Econ CA 3: The urban transport service volumes | |
| Average number of daily urban freight trips | |
| Average number of vehicles entering the city on a daily basis | |
| Econ CA 4: The city’ s urban transport service level | |
| Costs of alternative modes of urban passenger transport | |
| Share of passengers that use a smart method to pay for or validate a PT ticket (%) | |
| Share of PT vehicles that are equipped to provide real-time data that is released to passengers (%) | |
| Urban deliveries prices (€/package) | |
| Goods delivery frequency (average number of weekly deliveries to consumers) | |
| Econ CA 5: The urban transport operational costs & required investment costs? | |
| Additional private investments required (% of existing annual investment cost) | |
| ENVIRONMENT | Expected impact on |
| Env CA1: Climate change | |
| CO2 equivalent or greenhouse gas emissions | |
| Env CA2: Air quality index | |
| Air quality index | |
| SOCIETY | Soc CA1: Employment & social security? |
| Expected impact on | |
| Gig economy (external contractor) employment (% of total employees) | |
| Soc CA2: Safety & security? | |
| Expected impact on | |
| Share of urban mobility accidents involving micromobility means (%) | |
| Share of urban mobility accidents involving on-demand bike/scooter deliveries (%) | |
| Soc CA3: Access to mobility services? | |
| Expected impact on | |
| Affordability of using mobility services (citizens’ average annual cost of trips / annual income) | |
| Access to mobility services (ease with which all categories of passengers can use public transport) | |
| Accessibility for vulnerable groups to mobility services (ease with which vulnerable passengers can use public transport) |
An impact scale can be expressed either verbally under terms such as ‘increase’ – ‘decrease’ – ‘not affected’; or ‘no impact’ – ‘minor impact’, ‘moderate impact’ – ‘major impact’; or numerically such as -3, -2, -1, 0, +1, +2, +3. Where possible, each of these values is linked to quantitative intervals, for example:
| No impact | Minor impact | Moderate impact | Major impact |
| 0 | +1% to +15% | +16% to +50% | Ø 50% |
The selection of the respective interval values was based on an extended literature review of previous research surveys as well as on desktop research. Where no references could be found, the experience of the SPROUT partners involved was employed. The main purpose of this research was to give orientation and to align stakeholder’s inputs to the impact assessments. The resulting SPROUT Consequence Matrix which provides intervals for the respective indicators is provided here: Consequence Matrix
In this step, stakeholders are asked to assess the sustainability impacts of three scenarios that have been developed for each city: two scenarios are based on the outcome of the cross-impact balance analysis, and the third one is the result of the developments deemed most likely by local stakeholders.
The assessment builds upon the consequence matrix, as developed in the previous step. The assessment would be carried out in face-to-face workshops in which stakeholders discuss and agree on a value per indicator.
Due to travel and meeting restrictions under the Covid-19 pandemic, the implementation of physical meetings and workshops was not possible in the SPROUT project. Instead, stakeholder input was collected either via online surveys or in virtual workshops which were organised by the SPROUT cities.
Depending on the chosen format, two different approaches to aggregate stakeholders’ opinions into one single value per indicator were followed: (1) cities that implemented virtual workshops followed a direct consensus building approach, with stakeholders negotiating and agreeing on the value per indicator during the meeting. (2) Cities that collected responses through individual contacts with stakeholders used the 70% majority rule. That means, a consensus was considered as reached, when 70% of the stakeholders agreed in a specific survey question. In cases where the stakeholder’s opinion diverged strongly, different responses were noted.
A detailed description of the steps is provided in SPROUT Deliverable 3.2 Sustainability impact analysis of city-specific scenarios, Chapter 2 Methodology.
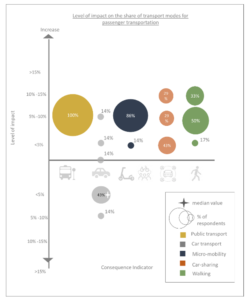
The following graph shows stakeholders’ assessment of the changes in the share of transport under Valenica’s scenario 1:
The stakeholder involvement would normally be conducted in focus group meetings. Due to the Covid-19 pandemic, however, the assessment of impacts was done via an online survey. An example survey is provided in the “tools and methods” section below.
Still, some cities implemented a virtual workshop for reaching consensus among their stakeholders. To support the local team, SPROUT partners compiled a guidance document: available here
SPROUT material and tools
- Factsheet: Sustainability impact analysis of city-specific scenarios
- SPROUT Indicators for assessing city scenarios
- Exemplary stakeholder survey: Annex II of D3.2
- Ranges for the individual indicators in the survey, including the studies from which they were derived, are described in Annex I of SROUT D3.2
Other relevant tools and methods
Data required
The stakeholder survey to assess the sustainability of scenarios builds upon Expert / practitioner’s knowledge
Further Information
Xenou, E., Ayfantopoulou, G., Royo, B., Tori, S., & Mazzarino, M. (2022). Methodology for Consequence Analysis of Future Mobility Scenarios: The SPROUT Framework. Future Transportation, 2(2), 453–466. https://doi.org/10.3390/futuretransp2020025


